2013 LLLT self-experiment
An LLLT user’s blinded randomized self-experiment in 2013 on the effects of near-infrared light on a simple cognitive test battery: positive results
A short randomized & blinded self-experiment on near-infrared LED light stimulation of one’s brain yields statistically-significant dose-related improvements to 4 measures of cognitive & motor performance. Concerns include whether the blinding succeeded and why the results are so good.
Low level laser therapy (LLLT) is the medical practice of shining infrared/visible light of particular wavelengths on body parts for potential benefits ranging from reduction of inflammation to pain-relief to faster healing. Despite the name, it’s generally done with arrays of LEDs since they are vastly cheaper and as good. LLLT seems to deliver real benefits in some applications to the body, but it remains an open question why exactly it works, since there is no obvious reason that shining some light on body parts would do anything at all much less help, and whether it would have any effects on one’s brain. (One theory is that light of the specific frequency is absorbed by an enzyme involved in synthesizing ATP, cytochrome c oxidase, and the extra ATP is responsible for the broad benefits, in which case methylene blue, with its similar mechanism, might also be helpful.)
There have been some small human neurological studies (most with severe methodological limitations) with generally positive results, such as et al 2015 on executive function; they are reviewed in et al 2012, Rojas & Gonzalez-2013, Gonzalez-2014. On the plus side, the non-brain studies indicate minimal risk of harm or negative side-effects (as do the studies in Rojas & Gonzalez-Lima 201312ya), and LED arrays emitting infrared light near the appropriate wavelengths are available for as low as $22.17$152013 since they are manufactured in bulk to illuminate outdoor scenes for infrared cameras. So one can try out LLLT safely & cheaply, and some people have done so.
At the time of this analysis, I knew of no reported studies examining LLLT’s effect on reaction-time. In March 201411ya, I learned of the small experiment Barrett & Gonzalez-2013 which reports improvement in reaction-time on the PVT & another task, and an improvement in mood. EnLilaSko did not record moods, but his reaction-time data is consistent with the results in Barrett & Gonzalez-Lima 201312ya.
Experiment
The Longecity user Nattzor (Reddit: EnLilaSko), a male Swedish Caucasian college student, attracted by the discussion in Lostfalco’s Longecity thread on LLLT & other topics, purchased a “Details about 48 LED illuminator light CCTV IR Infrared Night Vision” ($19.21$132013; 850nm1) to run his own self-experiment testing reaction-time.
Specifically, he did a n = 40 with two pairs of randomized blocks (result: ABBA) from 2013-09-16–3m2013-12-1712ya (with occasional breaks).
His blinding procedure:
I covered my eyes (to not see the lamp), ears (to not hear if it’s plugged in or not), hands (to not feel heat from the lamp) and used a water bag between the lamp and skin (to not feel heat). I asked my dad to walk into the room when I had prepared everything and to turn it on or not. The first 2 stages were done for about 12 minutes with about 1 minute per spot (I counted in my head, obviously not optimal), the last two stages were for 2 minutes (24 min total).
Randomization was done with the assistance of a second party:
What I do: Sit in a room with the lamp, literally blinded, headphones on, etc, then he comes in and either turns it on or doesn’t (I don’t know which he does), then he comes back and turn it off, does the same for the 10 day periods, then change (at least how we do now).
The tests were a battery on Quantified-Mind consisting of Choice Reaction Time (testing reaction time), visual matching (testing visual perception), sorting (testing executive function) and finger tapping (testing motor skills). Something obviously dumb from my part was not to check what areas of the brain that are related to those parts. If I have used LLLT on the front of my head and the function is related to an area at the back of the brain it’s obviously useless. I mainly did at the forehead and 2 spots back on the head.
Varying dose:
Some factors that are probably making the results fucked up is that the first two blocks were done with about 3 days rest between. The third phase was done maybe a month (probably more) after that (with double time, still placebo though) and then the fourth phase was done about a month after that, with no school at all (more focused, still double time). So it’s either because the long wait or that I respond waaaay better to LLLT with 2 minutes / place rather than 1 minute / place. I think that fucked up things hard, but can’t fix that now (if I don’t re-do the experiment).
… [applied to:] F3, F4, along the hairline, on the forehead and P3 and P42
Measurements:
The tests were a battery on Quantified-Mind consisting of Choice Reaction Time (testing reaction time)3, visual matching (testing visual perception), sorting (testing executive function) and finger tapping (testing motor skills). Something obviously dumb from my part was not to check what areas of the brain that are related to those parts. If I have used LLLT on the front of my head and the function is related to an area at the back of the brain it’s obviously useless. I mainly did at the forehead and 2 spots back on the head.
Analysis
Descriptive
He provided the data prior to his analysis, and I did my own. The basics:
lllt <- read.csv("https://gwern.net/doc/nootropic/quantified-self/2013-nattzor-lllt.csv")
lllt$LLLT <- as.logical(lllt$LLLT)
summary(lllt)
#     LLLT         Choice.Reaction.Time Visual.Matching    Sorting    Finger.Tapping
#  Mode :logical   Min.   :506          Min.   :554     Min.   :592   Min.   :504
#  FALSE:20        1st Qu.:543          1st Qu.:581     1st Qu.:606   1st Qu.:542
#  TRUE :20        Median :566          Median :584     Median :614   Median :560
#  NA's :0         Mean   :564          Mean   :586     Mean   :616   Mean   :560
#                  3rd Qu.:583          3rd Qu.:593     3rd Qu.:622   3rd Qu.:583
#                  Max.   :609          Max.   :612     Max.   :645   Max.   :610

cor(lllt[-1])
#                      Choice.Reaction.Time Visual.Matching Sorting Finger.Tapping
# Choice.Reaction.Time
# Visual.Matching                    0.4266
# Sorting                            0.6576          0.7173
# Finger.Tapping                     0.7982          0.5185  0.7070
As one would expect from the descriptions, the r correlations are all high and the same sign, indicating that they vary together a lot. (This also means it may be dangerous to use a set of independent t-tests since the p-values and standard errors could be all wrong, so one should use multivariate linear model + MANOVA.)
lllt$time <- 1:40
library(reshape2)
df.melt <- melt(lllt, id.vars=c('time', 'LLLT'))
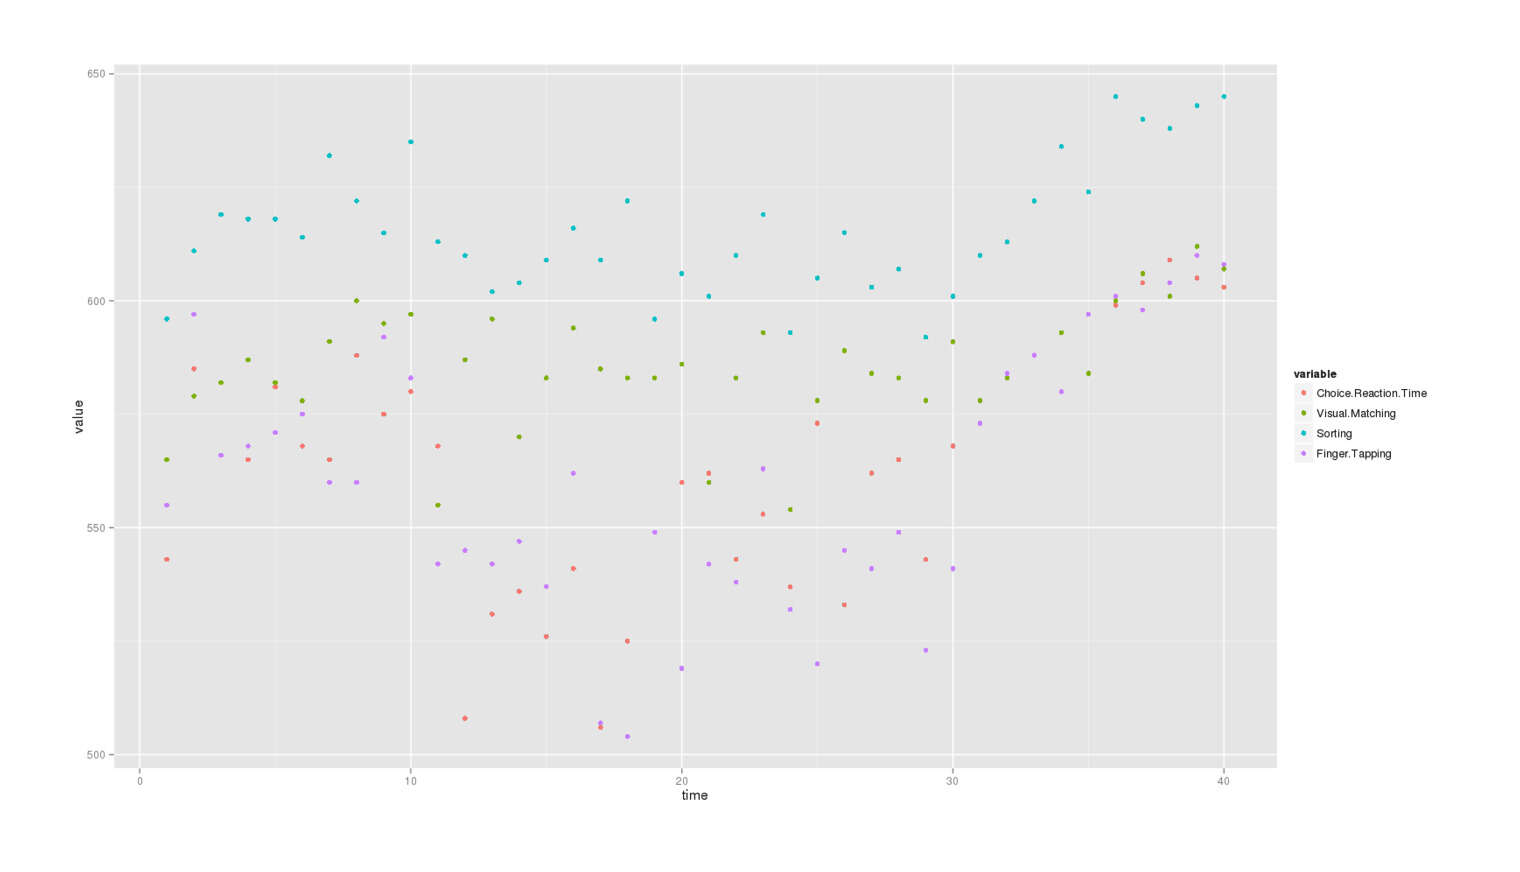
All data, colored by test type:

ggplot(df.melt, aes(x=time, y=value, colour=variable)) + geom_point()
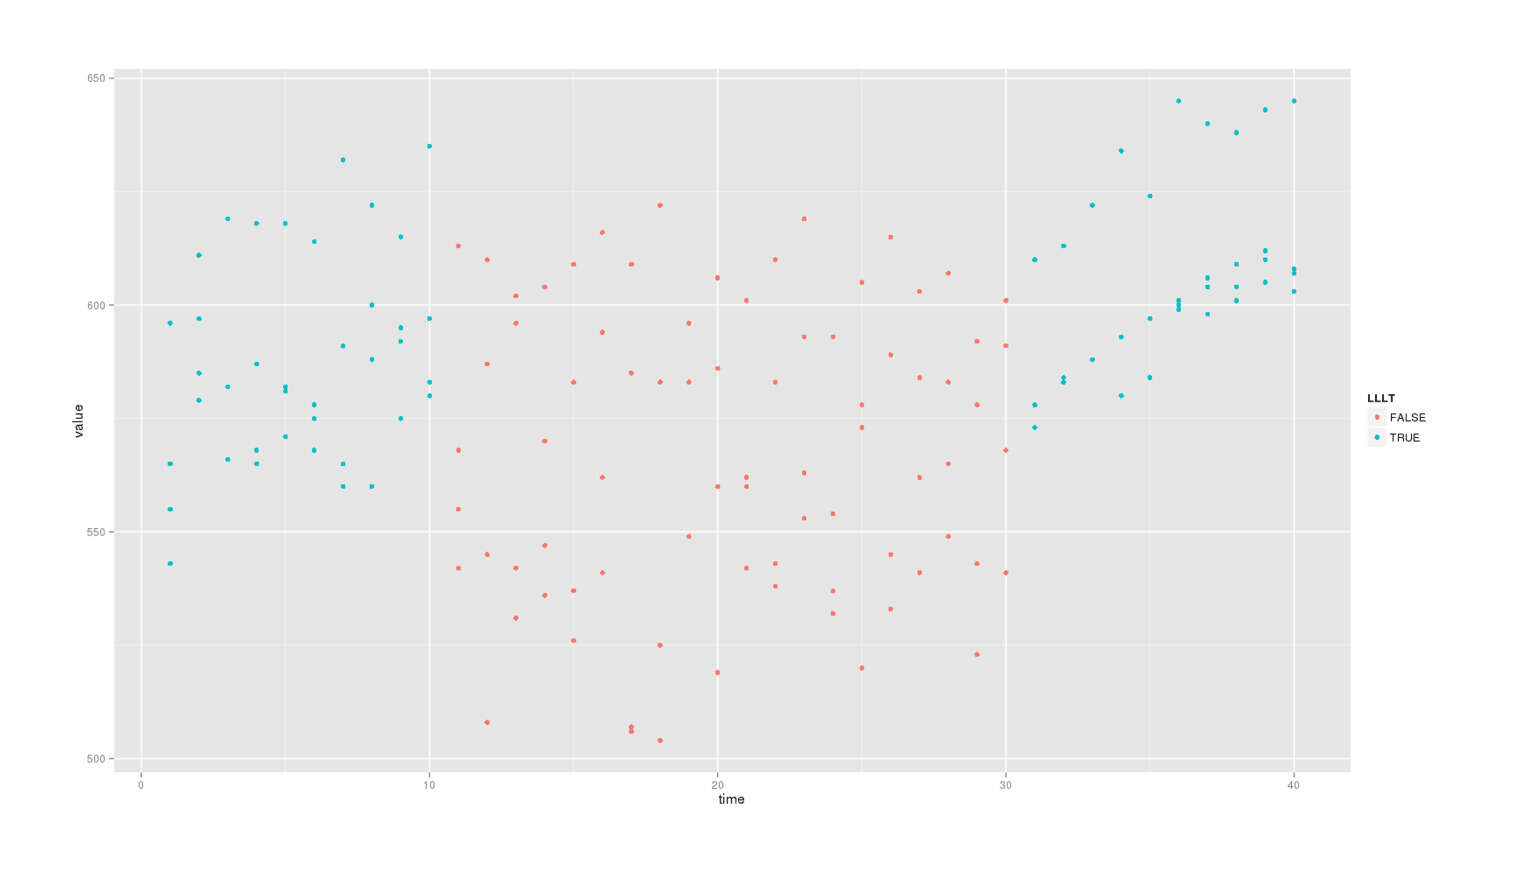
All data, colored by LLLT-affected:

ggplot(df.melt, aes(x=time, y=value, colour=LLLT)) + geom_point()
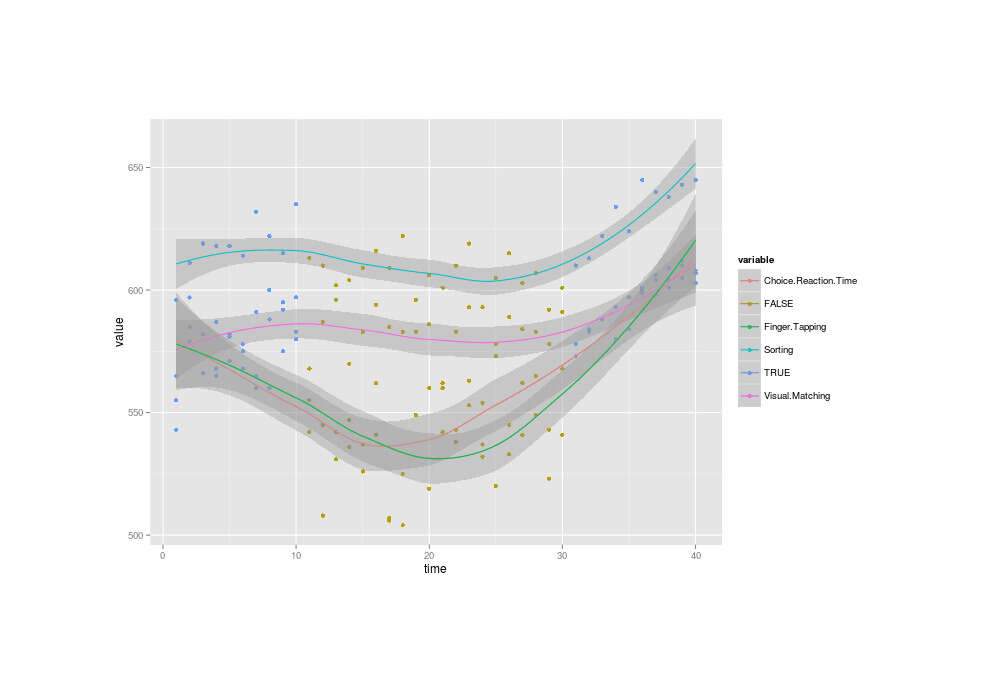
Combined (LLLT dose against smoothed performance curves; code courtesy of iGotMyPhdInThis):

ggplot(df.melt, aes(x=time, y=value, colour=variable)) + geom_point(data = df.melt, aes(x=time, y=value, colour=LLLT)) + geom_smooth()
The third (the second “A”) group of data looks very different from the other two groups, as not just are the scores all high, but they’re also very narrowly bunched in an ascending line compared to the really spread out second group or even the first group. What’s going on there? Pretty anomalous. This is at least partially related to the increased dose Nattzor used, but I feel that still doesn’t explain everything like why it’s steeply increasing over time or why the variance seems to narrow drastically.
Modeling
Binary Dose
At first I assumed that the LLLT doses were the same in all time periods, so I did a straight multivariate regression on a binary variable:
summary(lm(cbind(Choice.Reaction.Time, Visual.Matching, Sorting, Finger.Tapping) ~ LLLT, data=lllt))
# ...Response Choice.Reaction.Time :
#
# Coefficients:
#             Estimate Std. Error t value Pr(>|t|)
# (Intercept)   544.45       4.03  135.15  < 2e-16
# LLLT           39.20       5.70    6.88  3.6e-08
#
# Response Visual.Matching :
#
# Coefficients:
#             Estimate Std. Error t value Pr(>|t|)
# (Intercept)   580.75       2.69  216.22   <2e-16
# LLLT            9.65       3.80    2.54    0.015
#
# Response Sorting :
#
# Coefficients:
#             Estimate Std. Error t value Pr(>|t|)
# (Intercept)   606.65       2.50   242.2  < 2e-16
# LLLT           18.05       3.54     5.1  9.9e-06
#
# Response Finger.Tapping :
#
# Coefficients:
#             Estimate Std. Error t value Pr(>|t|)
# (Intercept)   537.40       3.67  146.29  < 2e-16
# LLLT           46.10       5.20    8.87  8.5e-11

p.adjust(c(3.6e-08, 0.015, 9.9e-06, 8.5e-11), method="BH") < 0.05
# [1] TRUE TRUE TRUE TRUE

summary(manova(lm(cbind(Choice.Reaction.Time, Visual.Matching, Sorting, Finger.Tapping) ~ LLLT, data=lllt)))
#           Df Pillai approx F num Df den Df  Pr(>F)
# LLLT       1   0.71     21.4      4     35 5.3e-09
# Residuals 38
For all 4 tests, higher=better; since all the coefficients are positive, this suggests LLLT helped. The MANOVA agrees that LLLT made an overall difference. All the coefficients are statistically-significant and pass multiple-correction too.
Generally, we’re not talking huge absolute differences here: like <10% of the raw scores (eg. Visual.Matching: 9.65 / 580.75 = 0.01662). But the scores don’t vary vmuch over time, so the LLLT influence sticks out with large effect-sizes (eg. 9.65 / sd(lllt$Visual.Matching) → d = 0.75).
Since the variables were so highly intercorrelated, I was curious if a single z-score combination would show different results, but it didn’t:
lllt$All <- with(lllt, scale(Choice.Reaction.Time) + scale(Visual.Matching) +
                       scale(Sorting) + scale(Finger.Tapping))
summary(lm(All ~ LLLT, data=lllt))
# Coefficients:
#             Estimate Std. Error t value Pr(>|t|)
# (Intercept)   -2.552      0.505   -5.05  1.1e-05
# LLLTTRUE       5.103      0.714    7.14  1.6e-08
#
# ...
# Coefficients:
#             Estimate Std. Error t value Pr(>|t|)
# (Intercept)   -2.552      0.505   -5.05  1.1e-05
# LLLTTRUE       5.103      0.714    7.14  1.6e-08
Continuous Dose
Then I learned Nattzor had actually doubled the time spent on LLLT in the second group. That means the right analysis is going to be different, since I need to take into account the dose size in case that matters, which it turns out, it does (as one would expect since Nattzor doubled the time for the same group I was wondering why it was so high in the graphs). So I redid the analysis by regressing on a continuous dose variable measured in minutes, rather than a binary dose/no-dose:
lllt$Dose <- c(rep(12, 10), rep(0, 20), rep(20, 10))
l1 <- lm(cbind(Choice.Reaction.Time, Visual.Matching, Sorting, Finger.Tapping) ~ LLLT, data=lllt)
l2 <- lm(cbind(Choice.Reaction.Time, Visual.Matching, Sorting, Finger.Tapping) ~ Dose, data=lllt)
summary(l2)
# Coefficients:
#             Estimate Std. Error t value Pr(>|t|)
# (Intercept)  544.306      3.553   153.2  < 2e-16
# Dose           2.468      0.305     8.1  8.4e-10
#
# Response Visual.Matching :
#
# Coefficients:
#             Estimate Std. Error t value Pr(>|t|)
# (Intercept)  580.219      2.523  229.96   <2e-16
# Dose           0.669      0.216    3.09   0.0037
#
# Response Sorting :
#
# Coefficients:
#             Estimate Std. Error t value Pr(>|t|)
# (Intercept)   606.16       2.22  273.39  < 2e-16
# Dose            1.19       0.19    6.25  2.6e-07
#
# Response Finger.Tapping :
#
# Coefficients:
#             Estimate Std. Error t value Pr(>|t|)
# (Intercept)  537.561      3.140   171.2  < 2e-16
# Dose           2.861      0.269    10.6  6.1e-13
And compared it to the prior regression to see which fit better:
anova(l1,l2)
#   Res.Df Df Gen.var. Pillai approx F num Df den Df Pr(>F)
# 1     38         151
# 2     38  0      138      0               0      0
The second dose model fits far better.
Robustness
One might ask based on the graph: is this all being driven by that anomalous third-group? Where the dose was increased? No, because even if we ignore the third group, the results are very similar:
summary(lm(cbind(Choice.Reaction.Time, Visual.Matching, Sorting, Finger.Tapping) ~ Dose, data=lllt[1:30,]))
# Response Choice.Reaction.Time :
#
# Coefficients:
#             Estimate Std. Error t value Pr(>|t|)
# (Intercept)  544.450      3.986  136.58  < 2e-16
# Dose           2.396      0.575    4.16  0.00027
#
# Response Visual.Matching :
#
# Coefficients:
#             Estimate Std. Error t value Pr(>|t|)
# (Intercept)  580.750      2.605  222.94   <2e-16
# Dose           0.404      0.376    1.07     0.29
#
# Response Sorting :
#
# Coefficients:
#             Estimate Std. Error t value Pr(>|t|)
# (Intercept)  606.650      2.028  299.18   <2e-16
# Dose           0.946      0.293    3.23   0.0031
#
# Response Finger.Tapping :
#
# Coefficients:
#             Estimate Std. Error t value Pr(>|t|)
# (Intercept)  537.400      3.413  157.44   <2e-16
# Dose           2.942      0.493    5.97    2e-06
The Visual.Matching response variable loses a lot of its strength, but in general, the results look the same as before: positive coefficients with statistically-significant effects of LLLT.
Training Effects
The anomalous third group prompts me to wonder if maybe it reflects a practice effect where subjects slowly get better at tasks over time. A quick cheap gesture towards time-series analysis is to just insert the index of each set of results and use that in the regression. But there seems to be only a small and statistically-insignificant result of all scores increasing with time:
lllt$Time <- 1:40
l1 <- lm(cbind(Choice.Reaction.Time, Visual.Matching, Sorting, Finger.Tapping) ~ Dose, data=lllt)
l2 <- lm(cbind(Choice.Reaction.Time, Visual.Matching, Sorting, Finger.Tapping) ~ Dose + Time, data=lllt)
anova(l1, l2)
#   Res.Df Df Gen.var. Pillai approx F num Df den Df Pr(>F)
# 1     38         138
# 2     37 -1      137  0.131     1.28      4     34    0.3
Curiously, if I delete the anomalous third group and rerun, the Time variable becomes much more significant:
lllt <- lllt[1:30,]
# ...
anova(l1, l2)
#   Res.Df Df Gen.var. Pillai approx F num Df den Df Pr(>F)
# 1     28         153
# 2     27 -1      142  0.367     3.47      4     24  0.023
But the gain is being driven by Choice.Reaction.Time and 2 of the coefficients are now even negative:
summary(l2)
# Response Choice.Reaction.Time :
#
# Coefficients:
#             Estimate Std. Error t value Pr(>|t|)
# (Intercept)  511.143     12.531   40.79  < 2e-16
# Dose           4.427      0.896    4.94  3.6e-05
# Time           1.625      0.586    2.77   0.0099
#
# Response Visual.Matching :
#
# Coefficients:
#             Estimate Std. Error t value Pr(>|t|)
# (Intercept)  570.534      9.053   63.02   <2e-16
# Dose           1.027      0.648    1.59     0.12
# Time           0.498      0.423    1.18     0.25
#
# Response Sorting :
#
# Coefficients:
#             Estimate Std. Error t value Pr(>|t|)
# (Intercept)  608.885      7.212   84.43   <2e-16
# Dose           0.810      0.516    1.57     0.13
# Time          -0.109      0.337   -0.32     0.75
#
# Response Finger.Tapping :
#
# Coefficients:
#             Estimate Std. Error t value Pr(>|t|)
# (Intercept) 537.7977    12.1631   44.22   <2e-16
# Dose          2.9174     0.8700    3.35   0.0024
# Time         -0.0194     0.5686   -0.03   0.9730
So it seems that the third group is driving the apparent training effect.
Discussion
The methodology was not the usual worthless self-report: Nattzor systematically recorded objective metrics in a randomized intervention with even an attempt at blinding; the effect sizes are large, the p-values small. Overall, Nattzor has conducted an excellent self-experiment which is a model for others to emulate.
Still, Nattzor is just one man, so the problem of external validity remains, and I am troubled by the anomaly in the third group (even if the overall results are robust to excluding that data entirely). And in part, I find his results too good to be true - usually self-experiments just don’t yield results this powerful. In particular, I’m concerned that despite his best efforts, the blinding may not have succeeded: perhaps some residual heat let him subconsciously figure out which block he was in (they were long and permitted time for guessing), or perhaps LLLT has some subjective effects which allow guessing even if it has no other benefits4 Nattzor didn’t record any data during the self-experiment about whether he had been able to guess whether he was being treated or not.
Followup Experiment
How I would modify Nattzor’s self-experiment to deal with my concerns, in roughly descending order of importance:
-
make some sort of blinding index: for example, each day you could write down after the testing what you think you got, and then when it’s done, check to see if you outperformed a coin flip. If you did, then the blinding failed and it’s just randomized
-
switch to much shorter blocks: closer to 3, maybe even just randomize daily; this helps minimize any learning/guessing of condition
-
omit any breaks and intervals, and do the experiment steadily to eliminate selection concerns
-
use a wider range of randomized doses: for example, 0.5 minutes, 1 minute, 2 minutes / place, or maybe 1/2/3 to see where the benefits being to break down
-
run the measurements on each day, even days without LLLT. I’m interested in the fadeout/washout - in the first experiment’s data, it looks like the effects of LLLT are almost instantaneous, which isn’t very consistent with a theory of increased repair and neural growth, which should take longer
-
upgrade to 808nm-wavelength LEDs for greater comparability with the research literature
-
808nm is more common in the research literature, but 850nm IR LEDs are easier to get.↩︎
-
See this chart of skull positions for an idea of the rough locations.↩︎
-
“Choice Reaction Time” is not, as it sounds like, measuring number of milliseconds, but rather some sort of video-game-like score.↩︎
-
For example, it is widely reported among people trying out LLLT that after the first application of the LEDs to the head, one feels weirdly tired for around an hour. I felt this myself upon trying, several people report it in the Lostfalco thread, and an acquaintance of mine who had never seen the Lostfalco thread and had tried out LLLT a year before I first heard of it mentioned he had felt the same exact thing. This feeling seems to go away after the first time, but perhaps it just becomes weaker?↩︎