YourMorals.Org |
||||
| Home |
Logout | Explore Your Morals | About Us | Links |
| Welcome gwern0@gmail.com - logout | ||||
|
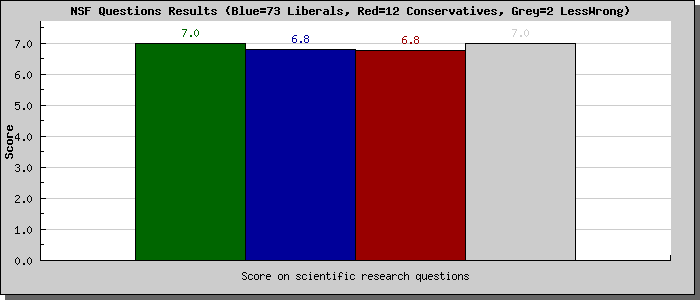
The scales you completed were designed to assess your familiarity with scientific research processes and your comfort with working with numerical information. The order in which you received them was randomied. One scale uses questions from the National Science Foundation's (NSF) 2010 Science and Engineering Indicators, which is an effort to track public knowledge and attitudes toward science and technology trends in the U.S. and other countries. For this survey, the items pertaining to understanding statistics, how to read data charts, and conducting an experiment were used.
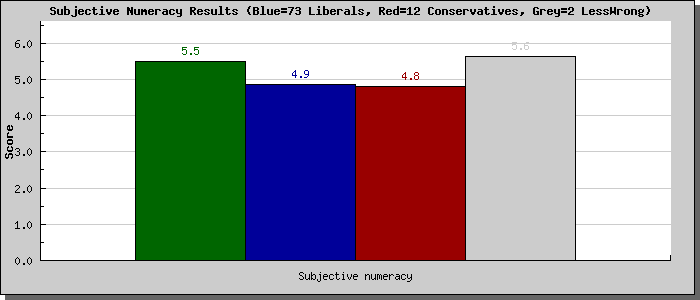
The other scale is the Subjective Numeracy Scale by Angela Fagerlin and colleagues, which measures individuals' preference for numerical information. Numeracy (adapted from the term 'literacy') represents individuals' ability to comprehend and use probabilities, ratios, and fractions. Traditional measures of numeracy ask people to perform mathematical operations, such as 'If person A’s risk of getting a disease is 1% in 10 years, and person B’s risk is double that of A’s, what is B’s risk?' However, some participants find these types of problems stressful and unpleasant, plus they are difficult to score in online studies. Subjective numeracy measures (like the scale you just took) are shown to be equally good measures of numeracy, without burdening participants. The reason we're interested in people's knowledge of scientific processes and comfort with numerical information is because it may help us understand how information processing affects judgments, such as individual differences in the "evaluating social science research" study, or "reasoning styles study" The first graph below shows your score on the NSF scientific research questions (with 7 being a perfect score). The second graph shows your score on the subjective numeracy scale (scores range from 1-6) and higher values mean a greater preference for and comfort with numerical information. The green bar shows your scores as they compare to the average liberal (shown in blue) and the average conservative (shown in red) who have taken this survey on our website.
 You are a member of the group:LessWrong and those results are shown with the Grey bar.  To learn more about the original NSF survey, which used a nationally representative sample of adults, click here
to read a summary of their 2010 results. To read about the scientific
research items (the same ones you did in this survey), jump to
"Reasoning and Understanding the Scientific Process". |
Return to the "Explore" page.
|