YourMorals.Org |
||||
| Home |
Logout | Explore Your Morals | About Us | Links |
| Welcome gwern0@gmail.com - logout | ||||
|
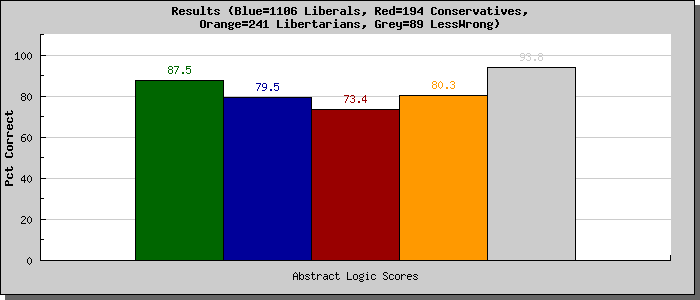
The scale you just completed was a test of formal logical reasoning, and was based on a scale originally developed by Ara Norenzayan, Edward Smith, Beom Jun Kim, and Richard Nisbett. The scale measures the extent to which people use formal vs. intuitive reasoning styles. Past research has shown cultural differences in these reasoning styles. For example, Norenzayan and colleagues (2002) found that Asians and Asian Americans were more likely to demonstrate intuitive (rather than formal) reasoning styles compared to European Americans.
You are a member of the group:LessWrong and those results are shown with the Grey bar. 
For example, consider the following logic problem: Premise 1: All animals which feed their young are mammals.
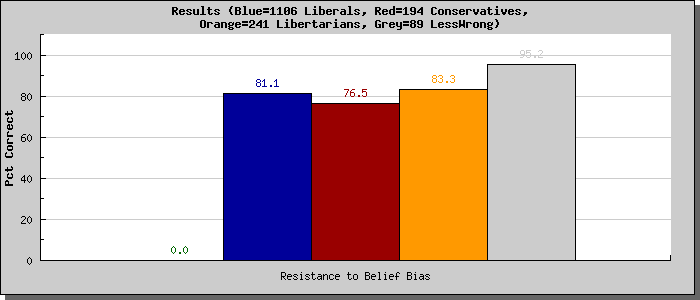
This problem is actually invalid, although it is often judged as valid because its conclusion is believable. In the graph below, scores range from 0% to 100%, with higher scores representing better performance (fewer errors) on questions related to belief bias. Thus, lower scores indicate a tendency to rate invalid arguments as valid when they contained believable conclusions, and to rate valid arguments as invalid when they contained less believable conclusions. The score of the average Liberal survey respondent is shown in blue (2nd bar), the average Conservative score is in red (3rd bar), and the average score for Libertarians is in orange. You were assigned to complete a different section of the study, so you will not have a score on this graph.You are a member of the group:LessWrong and those results are shown with the Grey bar. 
Premise 1: All things that add greenhouse gases into the atmosphere contribute to global warming.
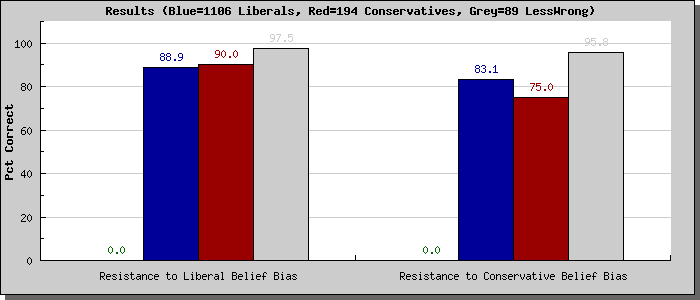
This problem is actually invalid, although it is sometimes judged as valid by liberals because its conclusion is believable to them. Half of the arguments from this section tested this kind of "liberal" belief bias, and half tested a "conservative" belief bias. In the graph below, you will see separate scores for these two forms of belief bias. Scores range from 0% to 100%, with higher scores representing better performance (fewer errors) on problems related to partisan belief bias. We expect liberals to be more resistant to "conservative" belief bias problems than "liberal" problems, and we expect the opposite pattern for conservatives. The scores of the average liberal respondent are shown in blue. The average conservative scores are shown in red. You were assigned to complete a different section of the study, so you will not have a score on this graph.You are a member of the group:LessWrong and those results are shown with the Grey bar.  Return to the "Explore" page. |
|